If you are wondering how to monitor your Linux servers like CPU Usage, RAM Usage, or Disk Space Usage, you can start monitoring them with Prometheus, Node Exporter, and Grafana.
What is Prometheus?
Prometheus is an open-source Linux Server Monitoring tool mainly used for metrics monitoring, event monitoring, alert monitoring, etc, and has become the Top-Level project of CNCF (Cloud Native Computing Foundation).
Prometheus uses PromQL as a powerful query language, it can handle hundreds of services and microservices and use multiple modes used for graphing and dashboarding support.
What is Grafana?
Grafana is a free and open-source visualization tool that monitors metrics and is mainly used with Prometheus. Grafana allows us to query, visualize, explore metrics, and set alerts for the data source which can be a system, server, nodes, cluster, etc.
We can create our dynamic dashboard for visualization and monitoring with some charts and graphs and save the dashboard to share with our team members or even with the public (communities).
What is Grafana Cloud?
Grafana Cloud is a composable observability platform, that integrates metrics, traces, and logs with Grafana. Query, visualize, alert on, and understand your metrics no matter where they are stored. Create, explore, and share beautiful dashboards with your team and foster a data-driven culture.
With Grafana Cloud on this tutorial, we don't have to install grafana locally on our system.
We will be using a free plan of Grafana cloud that includes 10,000 series for Prometheus or Graphite metrics, 50 GB of logs, 50 GB of traces, 14-day retention for metrics and logs, and access for up to 3 team members
What is Node Exporter?
Node exporter is one of the Prometheus exporters which is used to expose servers or system OS metrics. Node Exporter's main feature is to expose various resources of the system like RAM, CPU utilization, Memory Utilization, Network Bandwidth, Diskspace, Disk read/write (Disk I/O), etc.
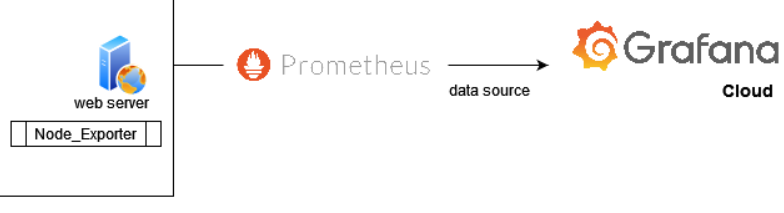
It runs as a system service on your Linux server, which gathers your system's metrics and displays them with the help of the Grafana visualization tool.
We will try to build it precisely like this diagram :
Prerequisites
- Linux OS (I'm using Ubuntu 18.04 on this tutorial)
- Root account with sudo privilege
- Required Ports: 9090 (Prometheus), 9100 (Node Exporter)
First of all, we need to update the system repository index by using the following command:
sudo apt update -yswitch to the root user by using the following command:
sudo su#1. Create Prometheus and Node Exporter System Users and Directory
We are going to create a Prometheus user named prometheus, a Node Exporter user named node_exporter, and a Prometheus Directory named Prometheus.
sudo useradd --no-create-home --shell /bin/false prometheussudo useradd --no-create-home --shell /bin/false node_exportersudo mkdir /etc/prometheus
sudo mkdir /var/lib/prometheusNote :
- That useradd command means that we are going to add a new user without creating its home directory and disable the shell.
- mkdir command is for creating a new directory
#2. Download Prometheus Binary File
Now we will download the latest version of Prometheus by copying the download link as per our Operating System from the Prometheus download page
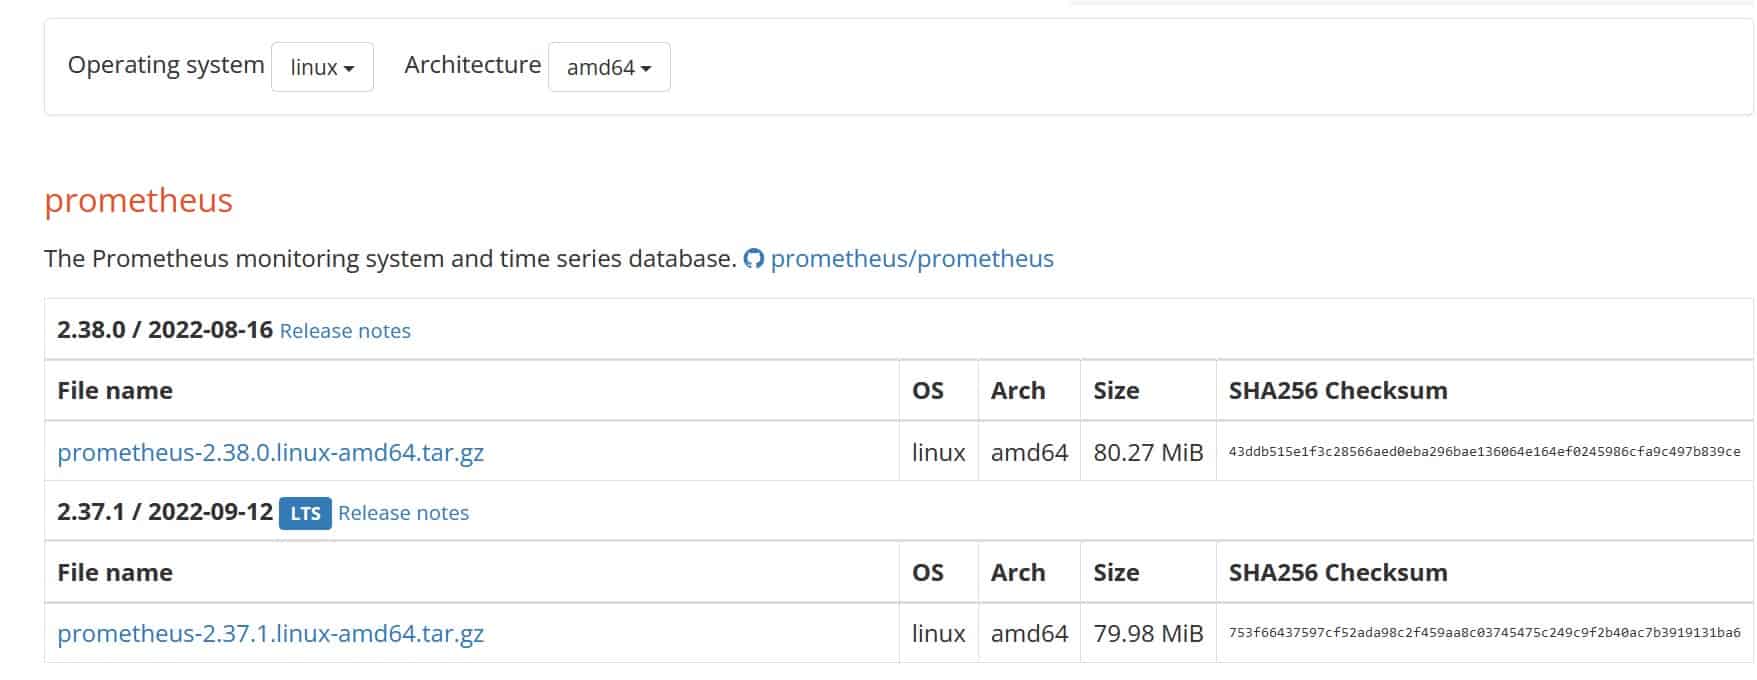
There are 2 versions of Prometheus right now, we will download the 2.37.1 version because the 2.37 will be the LTS version of Prometheus, supported until January 31, 2023. (Prometheus Long-Term Support Page).
Download the Prometheus setup using wget
wget https://github.com/prometheus/prometheus/releases/download/v2.37.1/prometheus-2.37.1.linux-amd64.tar.gzNow we have successfully downloaded the Prometheus binary file and extract the file by using the following command:
tar -xvf prometheus-2.37.1.linux-amd64.tar.gzNavigate to Prometheus extracted folder:
cd prometheus-2.37.1.linux-amd64/and then verify the list of setup files:
lsoutput:
root@redhawk:~/prometheus-2.37.1.linux-amd64# ls
console_libraries  LICENSE  prometheus      promtool
consoles           NOTICE   prometheus.yml
#3. Copy Prometheus File
Now we have extracted the Prometheus file in a directory (for example mine is /root/prometheus-2.37.1.linux-amd64)
Copy prometheus and promtool files into our /usr/local/bin directory by the following commands:
sudo cp /prometheus-2.37.1.linux-amd64/prometheus /usr/local/bin/
sudo cp /prometheus-2.37.1.linux-amd64/promtool /usr/local/bin/
Copy the prometheus.yml file, console and console_library folders into /etc/prometheus/ by the following commands:
sudo cp -r /prometheus-2.26.0.linux-amd64/consoles /etc/prometheus
sudo cp -r /prometheus-2.26.0.linux-amd64/console_libraries /etc/prometheus
sudo cp -r /prometheus-2.26.0.linux-amd64/prometheus.yml /etc/prometheus
#4. Update ownership
Now we have to update the ownership of those copied files before to ensure its run by Prometheus user by executing the following commands:
sudo chown prometheus:prometheus /usr/local/bin/prometheus
sudo chown prometheus:prometheus /usr/local/bin/promtool
sudo chown -R prometheus:prometheus /etc/prometheus/consoles
sudo chown -R prometheus:prometheus /etc/prometheus/console_libraries
sudo chown -R prometheus:prometheus /etc/prometheus/prometheus.yml
#5. Verify the Prometheus Version
After that, we have to ensure that Prometheus is installed on our system by checking the version of Prometheus and promtool by following the commands:
prometheus --version
promtool --version
the output should be:
root@redhawk:~/prometheus-2.37.1.linux-amd64# prometheus --version
prometheus version 2.37.1 (branch: HEAD, revision: 1ce2197e7f9e95089bfb95cb61762b5a89a8c0da)
  build user:       root@3caaaea7ba87
  build date:       20220912-12:42:39
  go version:       go1.18.6
  platform:         linux/amd64
root@redhawk:~/prometheus-2.37.1.linux-amd64# promtool --version
promtool, version 2.37.1 (branch: HEAD, revision: 1ce2197e7f9e95089bfb95cb61762b5a89a8c0da)
  build user:       root@3caaaea7ba87
  build date:       20220912-12:42:39
  go version:       go1.18.6
  platform:         linux/amd64
#6. Create Prometheus Systemd Startup file
In this step, we will set up the Prometheus systemd startup file to make sure the Prometheus runs as a service on our Ubuntu. Create a new system service file in /etc/systemd/system by using the following command:
sudo nano /etc/systemd/system/prometheus.serviceand then copy the below files into the newly created file:
[Unit]
Description=Prometheus
Wants=network-online.target
After=network-online.target
[Service]
User=prometheus
Group=prometheus
Type=simple
ExecStart=/usr/local/bin/prometheus \
    --config.file /etc/prometheus/prometheus.yml \
    --storage.tsdb.path /var/lib/prometheus/ \
    --web.console.templates=/etc/prometheus/consoles \
    --web.console.libraries=/etc/prometheus/console_libraries
[Install]
WantedBy=multi-user.target
Save the file with CTRL+O and exit with the CTRL+X
File Name to Write: prometheus.service
After the newly created service is saved, we have to reload the daemon services to reload the systemd manager configuration before starting the Prometheus service.
sudo systemctl daemon-reloadStart Prometheus service using the following command:
sudo systemctl start prometheusand then enable Prometheus service to make it always start automatically at boot.
sudo systemctl enable prometheusCheck whether the Prometheus service is running or not by following this command:
sudo systemctl status prometheusOutput:
root@redhawk:~# systemctl status prometheus
● prometheus.service - Prometheus
   Loaded: loaded (/etc/systemd/system/prometheus.service; enabled; vendor prese
   Active: active (running) since Wed 2022-09-14 16:45:29 UTC; 1 weeks 3 days ag
 Main PID: 27063 (prometheus)
    Tasks: 8 (limit: 2314)
   CGroup: /system.slice/prometheus.service
           └─27063 /usr/local/bin/prometheus --config.file /etc/prometheus/prome
#7. Install Node Exporter
After Prometheus was successfully installed, now we are going to install Node Exporter. Node Exporter's main feature is to expose various resources of the system like RAM, CPU utilization, Memory Utilization, Network Bandwidth, Diskspace, Disk read/write (Disk I/O), etc.
To install Node Exporter, navigate to Prometheus official download page again, scroll down until the node_exporter section, and then select Linux OS for amd64.
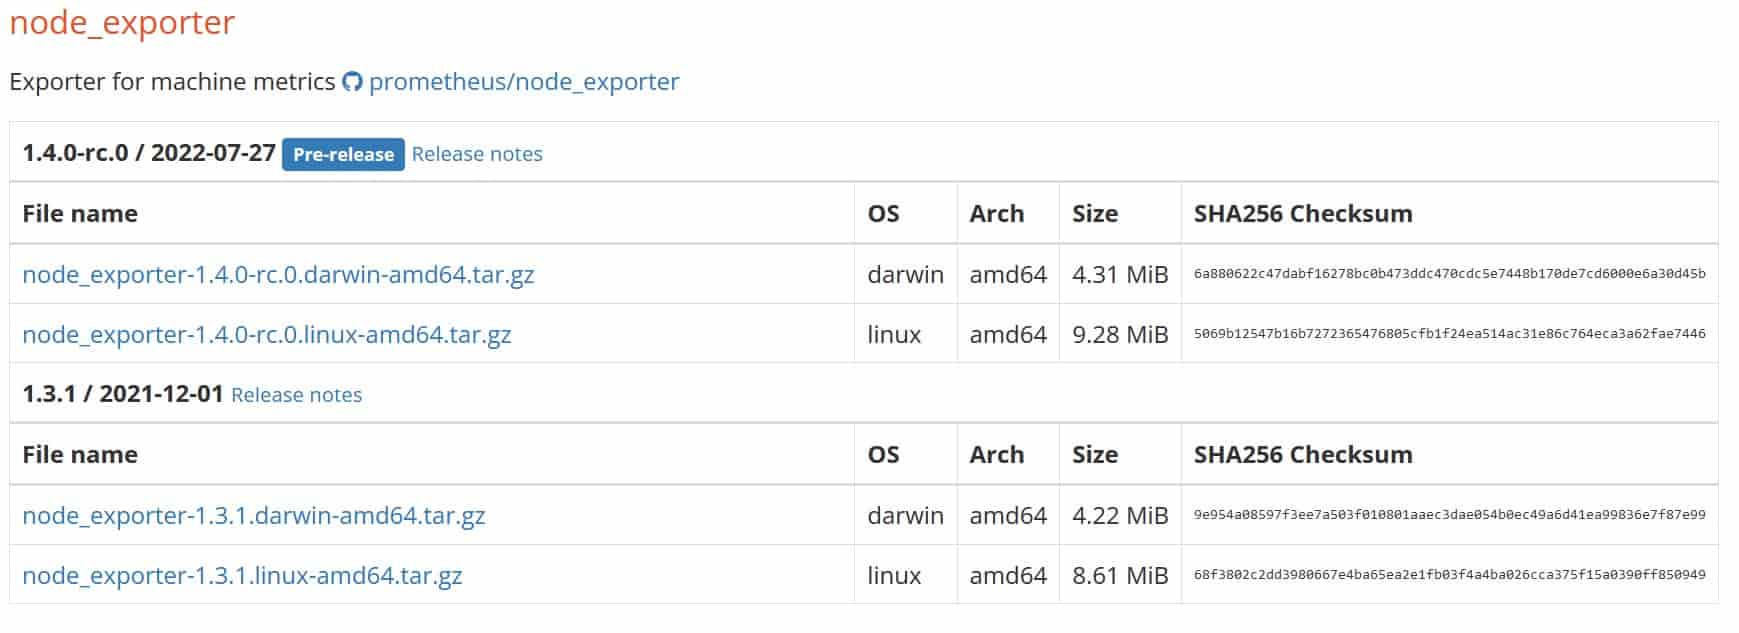
Right-click to grab the link (copy link address), and then paste it with wget command:
wget https://github.com/prometheus/node_exporter/releases/download/v1.3.1/node_exporter-1.3.1.linux-amd64.tar.gzExtract the downloaded file using the following command:
sudo tar xvzf node_exporter-1.3.1.linux-amd64.tar.gzMove to inside the folder
cd node_exporter-1.2.0.linux-amd64View the extracted files with ls and then you can see the node_exporter binary file, copy it into your /usr/local/bin directory using the following command:
sudo cp node_exporter /usr/local/bin#8. Create Node_Exporter Systemd Startup file
Now let's create a node_exporter service in /etc/systemd/system named node_exporter.service like Prometheus service before using the following commands:
sudo nano /etc/systemd/system/node_exporter.serviceand then copy the below files into the newly created file:
[Unit]
Description=Node Exporter
Wants=network-online.target
After=network-online.target

[Service]
User=node_exporter
Group=node_exporter
Type=simple
ExecStart=/usr/local/bin/node_exporter
Restart=always
RestartSec=10s

[Install]
WantedBy=multi-user.target
Now let's start and enable the node_exporter service using the following commands
sudo systemctl daemon-reloadsudo systemctl enable node_exporter
sudo systemctl start node_exporterCheck whether the Node Exporter service is running or not by following this command:
sudo systemctl status node_exporter#9. Configure the Node Exporter as a Prometheus target
Now to scrape node_exporter metrics let's configure the Prometheus by editing the prometheus.yml file:
sudo nano /etc/prometheus/prometheus.ymlNow in static_configs in your configuration file replace the target line with the below one:
- targets: ['localhost:9090', 'localhost:9100']Restart the Prometheus service to apply the change.
sudo systemctl restart prometheus#10. Create NGINX vhost config to Reverse Proxy
If you follow this tutorial and install it on the live server (not a GUI version), you may create an nginx vhost config first to reverse proxy the Prometheus service (which runs on localhost port 9090).
server {
    server_name your.hostname.com;
    location / {
            proxy_set_header X-Real-IP $remote_addr;
            proxy_set_header X-Forwarded-For $proxy_add_x_forwarded_for;
            proxy_set_header X-NginX-Proxy true;
            proxy_pass http://127.0.0.1:9090/;
            proxy_ssl_session_reuse off;
            proxy_set_header Host $http_host;
            proxy_cache_bypass $http_upgrade;
            proxy_set_header X-Forwarded-Proto $scheme;
            proxy_read_timeout 900;
            proxy_redirect off;
    }

    listen 80;
}
Now hit the URL in your web browser to check whether our target is successfully scraped by Prometheus or not
http://your.hostname.com/targets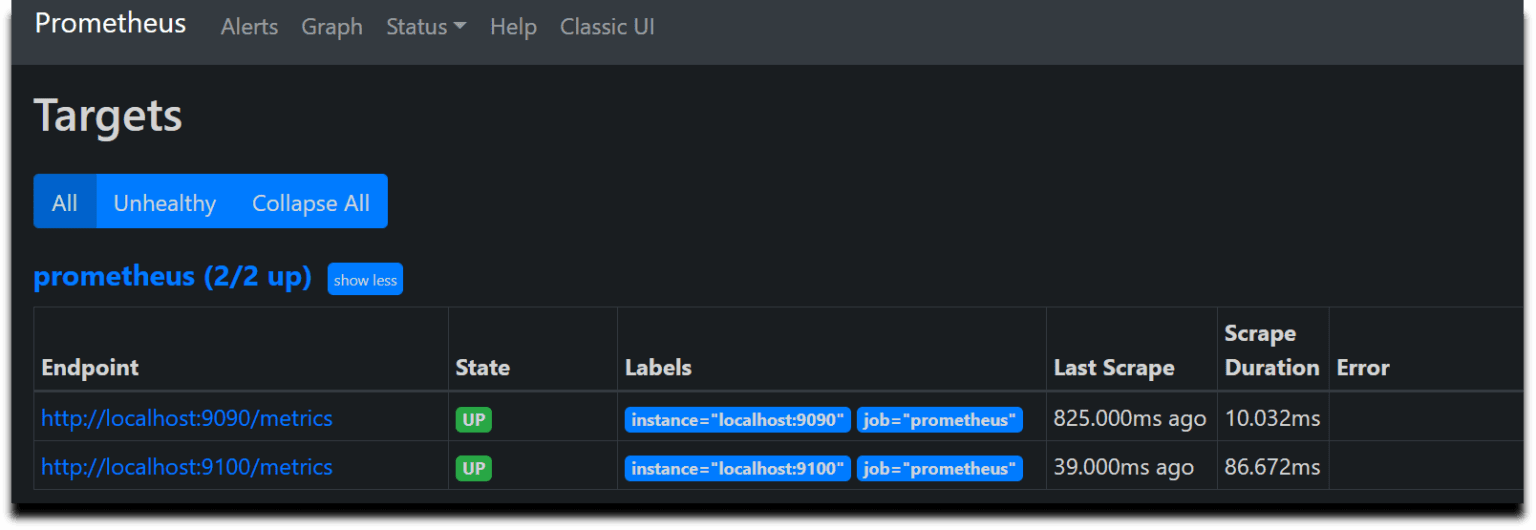
#11. Creating Grafana Dashboard on Grafana Cloud.
After Prometheus and node_exporter are successfully installed, we can start creating Grafana Cloud account by visiting this page https://grafana.com/auth/sign-up/create-user
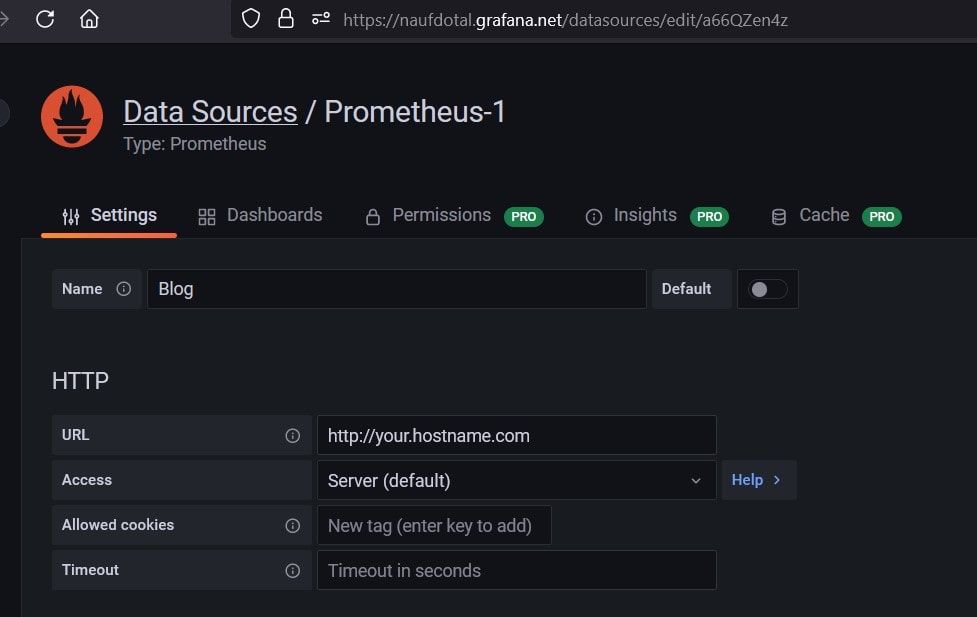
After your Grafana account is successfully deployed, you can start creating the dashboard with your own URL (like mine is naufdotal.grafana.net) by adding new data sources first. the Prometheus Data Sources.
- Access the Datasources menu (Configuration ->Data sources), and then click add datasource.
- Choose Prometheus (Time series database)
- On the HTTP URL fill it with your Prometheus URL (like we created before)
your.hostname.com - Click Save & Test to apply the change.
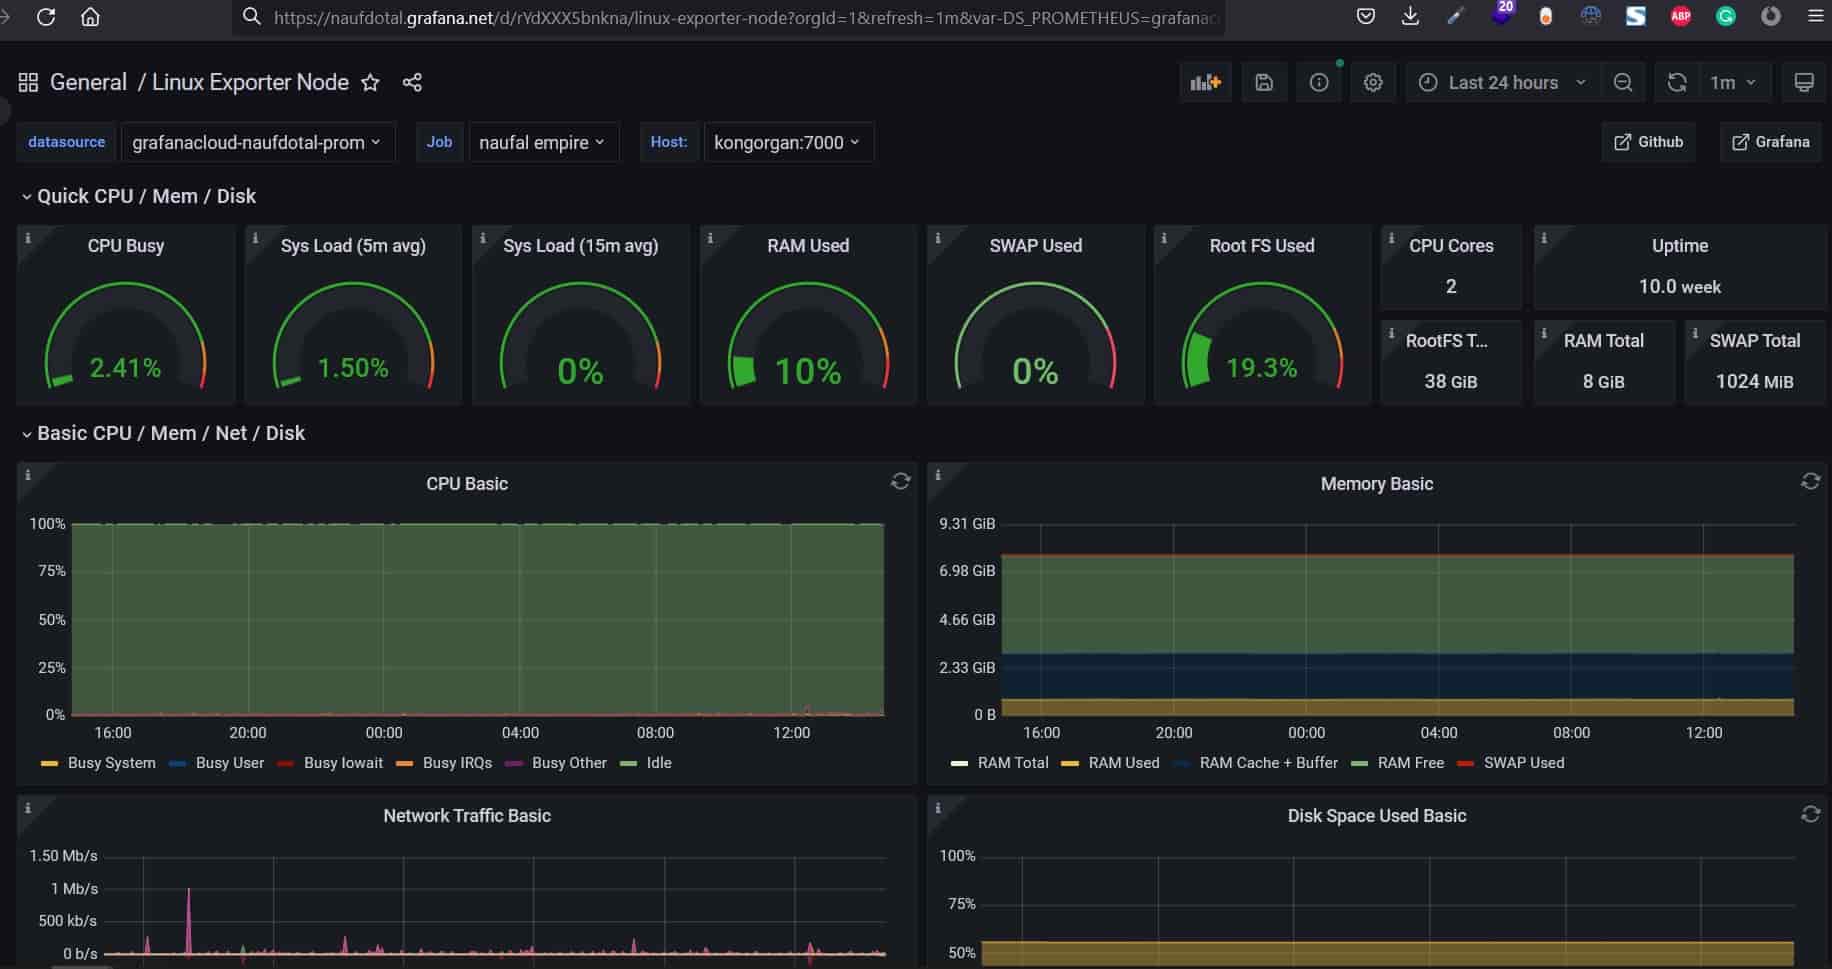
Now let's build a dashboard in Grafana so then it will be able to reflect the metrics of the Linux system.
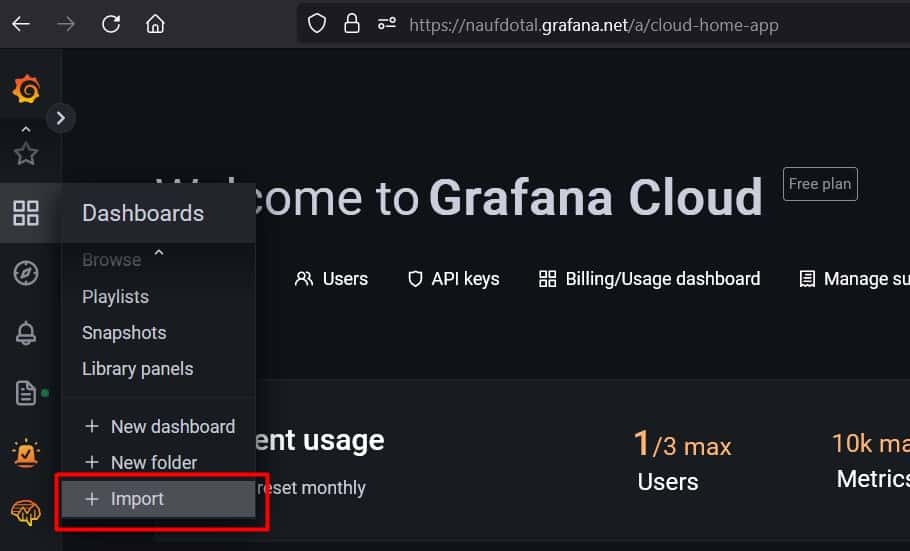
So we will use 14513 to import Grafana.com, let's come to the Grafana Home page and you can see a “box” icon. Click on that and select “Import”
Now provide the Grafana.com Dashboard ID which is 14513 and click on Load
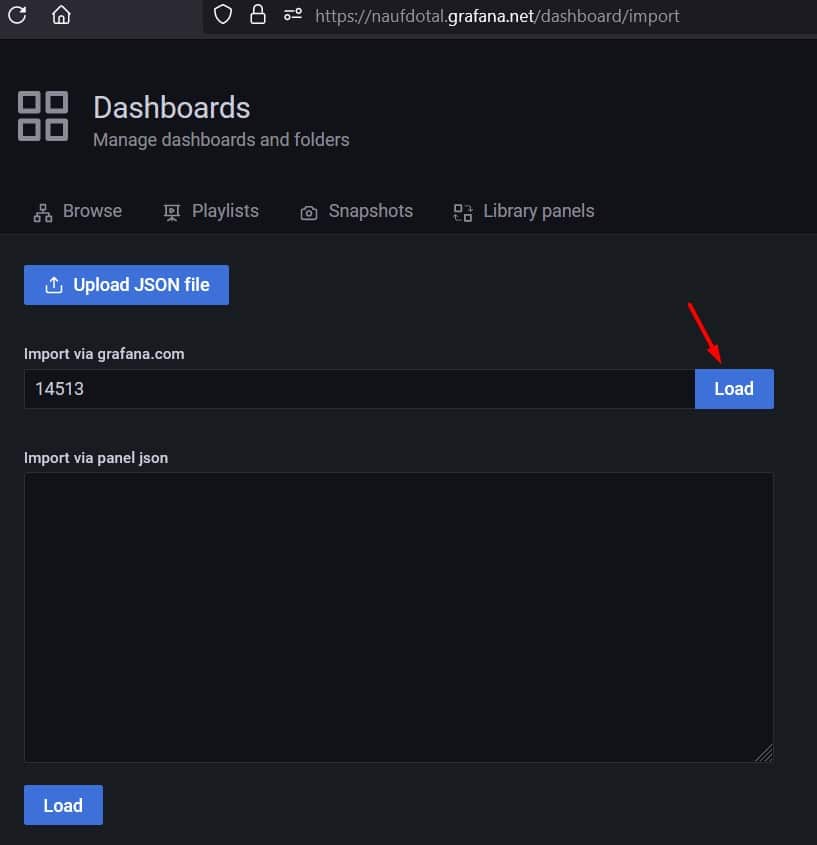
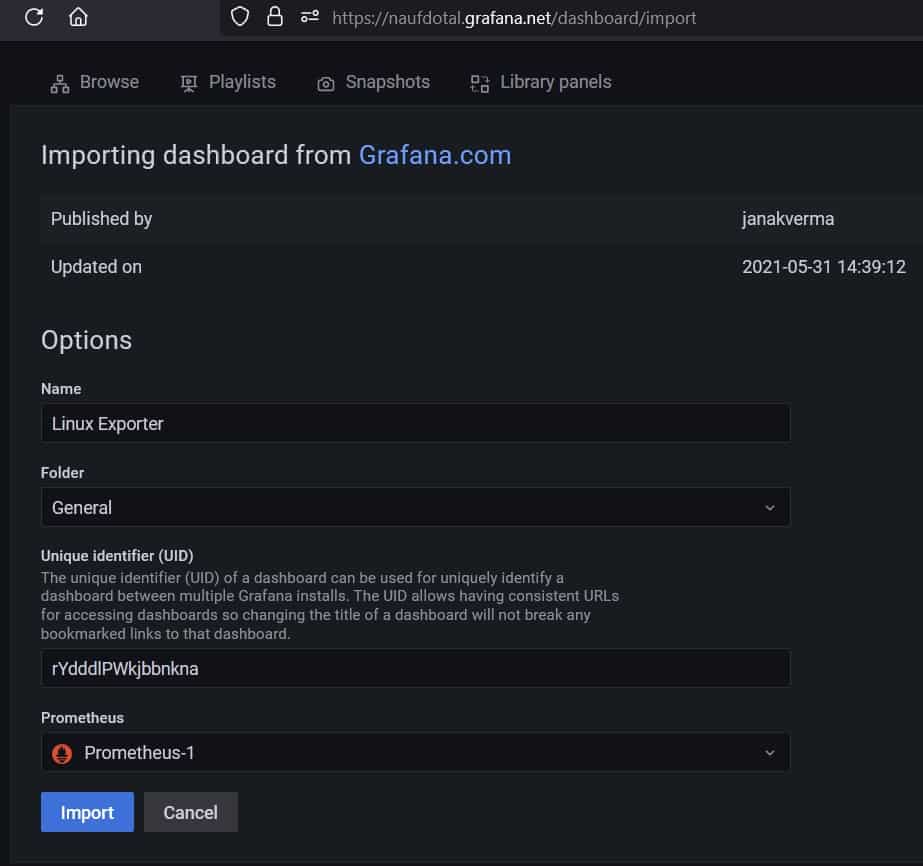
Now provide the name and select the Prometheus Datasource and click on Import.
There you are done with the setup. Now your Grafana Cloud Dashboard is running up!